Wick Pressure Zones [BigBeluga]
The Wick Pressure Zones indicator highlights areas where extreme wick activity occurred, signaling strong buy or sell pressure. By measuring unusually long upper or lower wicks and mapping them into gradient volume zones , the tool helps traders identify levels where liquidity was absorbed, leaving behind footprints of supply and demand imbalances. These zones often act as support, resistance, or liquidity sweep magnets .
🔵 CONCEPTS
Extreme Wicks : Large upper or lower shadows indicate aggressive rejection — upper wicks suggest selling pressure, lower wicks suggest buying pressure.
Volumatic Gradient Zones : From each detected wick, the indicator projects a layered gradient zone, proportional to the wick’s size, showing where most pressure occurred.
Liquidity Footprints : These zones mark levels where significant buy/sell volume was executed, often becoming reaction points on future retests.
Automatic Expiration : Zones persist until price decisively trades through them, after which they are cleared to keep the chart clean.
🔵 FEATURES
Automatic Wick Detection : Identifies extreme upper and lower wick events using percentile filtering and Realative Strength Index.
Gradient Zone Visualization : Builds a 10-layer zone from the wick top/bottom, shading intensity according to pressure strength.
Volume Labels : Each zone is annotated with the bar’s volume at the origin point for added context.
Dynamic Zone Extension : Zones extend to the right as long as they remain relevant; once price closes through them, they are removed.
Support & Resistance Mapping : Upper wick zones (red) behave like supply/resistance, lower wick zones (green) like demand/support.
Clutter Control : Limits the number of active zones (default 10) to keep charts responsive.
Background Highlighting : Optional background shading when new wick zones appear (red for sell, green for buy).
🔵 HOW TO USE
Look for Upper Wick Zones (red) : Indicate strong selling pressure; watch for resistance, reversals, or liquidity sweeps above.
Look for Lower Wick Zones (green) : Indicate strong buying pressure; watch for support or liquidity sweeps below.
Trade Retests : When price returns to a zone, expect a reaction (bounce or rejection) due to leftover liquidity.
Combine with Context : Align wick pressure zones with HTF support/resistance, order blocks, or volume profile for stronger signals.
Use Volume Labels : High-volume wicks indicate more significant liquidity events, making the zone more likely to act as a strong reaction point.
🔵 CONCLUSION
The Wick Pressure Zones is a powerful way to visualize hidden liquidity and aggressive rejections. By mapping extreme wick events into dynamic, volume-annotated zones, it shows traders where the market absorbed heavy buy/sell pressure. These levels frequently act as magnets or turning points, making them valuable for timing entries, stop placement, or fade strategies.
Tìm kiếm tập lệnh với "supply and demand"

Leg Out Candle V2.0The Script marks candles that could be considered as a leg out of a supply/demand and are bigger than the previous ones based on the adjustable lookback value. There is also the option to adjust the threshold ob the body to wick ratio of the leg out candle. The lowest value is 50% because anything lower would be a basing candle.

Alpha - Combined BreakoutThis Pine Script indicator, "Alpha - Combined Breakout," is a combination between Smart Money Breakout Signals and UT Bot Alert, The UT Bot Alert indicator was initially developer by Yo_adriiiiaan
The idea of original code belongs HPotter.
This Indicator helps you identify potential trading opportunities by combining two distinct strategies: Smart Money Breakout and a modified UT Bot (likely a variation of the Ultimate Trend Bot). It provides visual signals, draws lines for potential take profit (TP) and stop loss (SL) levels, and includes a dashboard to track performance metrics.
Tutorial:
Understanding and Using the "Alpha - Combined Breakout" Indicator
This indicator is designed for traders looking for confirmation of market direction and potential entry/exit points by blending structural analysis with a trend-following oscillator.
How it Works (General Concept)
The indicator combines two main components:
Smart Money Breakout: This part identifies significant breaks in market structure, which "smart money" traders often use to gauge shifts in supply and demand. It looks for higher highs/lows or lower highs/lows and flags when these structural points are broken.
UT Bot: This is a trend-following component that generates buy and sell signals based on price action relative to an Average True Range (ATR) based trailing stop.
You can choose to use these signals independently or combined to generate trading alerts and visual cues on your chart. The dashboard provides a quick overview of how well the signals are performing based on your chosen settings and display mode.
Parameters and What They Do
Let's break down each input parameter:
1. Smart Money Inputs
These settings control how the indicator identifies market structure and breakouts.
swingSize (Market Structure Time-Horizon):
What it does: This integer value defines the number of candles used to identify significant "swing" (pivot) points—highs and lows.
Effect: A larger swingSize creates a smoother market structure, focusing on longer-term trends. This means signals might appear less frequently and with some delay but could be more reliable for higher timeframes or broader market movements. A smaller swingSize will pick up more minor market structure changes, leading to more frequent but potentially noisier signals, suitable for lower timeframes or scalping.
Analogy: Think of it like a zoom level on your market structure map. Higher values zoom out, showing only major mountain ranges. Lower values zoom in, showing every hill and bump.
bosConfType (BOS Confirmation Type):
What it does: This string input determines how a Break of Structure (BOS) is confirmed. You have two options:
'Candle Close': A breakout is confirmed only if a candle's closing price surpasses the previous swing high (for bullish) or swing low (for bearish).
'Wicks': A breakout is confirmed if any part of the candle (including its wick) surpasses the previous swing high or low.
Effect: 'Candle Close' provides stronger, more conservative confirmation, as it implies sustained price movement beyond the structure. 'Wicks' provides earlier, more aggressive signals, as it captures momentary breaches of the structure.
Analogy: Imagine a wall. 'Candle Close' means the whole person must get over the wall. 'Wicks' means even a finger touching over the top counts as a breach.
choch (Show CHoCH):
What it does: A boolean (true/false) input to enable or disable the display of "Change of Character" (CHoCH) labels. CHoCH indicates the first structural break against the current dominant trend.
Effect: When true, it helps identify early signs of a potential trend reversal, as it marks where the market's "character" (its tendency to make higher highs/lows or lower lows/highs) first changes.
BULL (Bullish Color) & BEAR (Bearish Color):
What they do: These color inputs allow you to customize the visual appearance of bullish and bearish signals and lines drawn by the Smart Money component.
Effect: Purely cosmetic, helps with visual identification on the chart.
sm_tp_sl_multiplier (SM TP/SL Multiplier (ATR)):
What it does: A float value that acts as a multiplier for the Average True Range (ATR) to calculate the Take Profit (TP) and Stop Loss (SL) levels specifically when you're in "Smart Money Only" mode. It uses the ATR calculated by the UT Bot's nLoss_ut as its base.
Effect: A higher multiplier creates wider TP/SL levels, potentially leading to fewer trades but larger wins/losses. A lower multiplier creates tighter TP/SL levels, potentially leading to more frequent but smaller wins/losses.
2. UT Bot Alerts Inputs
These parameters control the behavior and sensitivity of the UT Bot component.
a_ut (UT Key Value (Sensitivity)):
What it does: This integer value adjusts the sensitivity of the UT Bot.
Effect: A higher value makes the UT Bot less sensitive to price fluctuations, resulting in fewer and potentially more reliable signals. A lower value makes it more sensitive, generating more signals, which can include more false signals.
Analogy: Like a noise filter. Higher values filter out more noise, keeping only strong signals.
c_ut (UT ATR Period):
What it does: This integer sets the look-back period for the Average True Range (ATR) calculation used by the UT Bot. ATR measures market volatility.
Effect: This period directly influences the calculation of the nLoss_ut (which is a_ut * xATR_ut), thus defining the distance of the trailing stop loss and take profit levels. A longer period makes the ATR smoother and less reactive to sudden price spikes. A shorter period makes it more responsive.
h_ut (UT Signals from Heikin Ashi Candles):
What it does: A boolean (true/false) input to determine if the UT Bot calculations should use standard candlestick data or Heikin Ashi candlestick data.
Effect: Heikin Ashi candles smooth out price action, often making trends clearer and reducing noise. Using them for UT Bot signals can lead to smoother, potentially delayed signals that stay with a trend longer. Standard candles are more reactive to raw price changes.
3. Line Drawing Control Buttons
These crucial boolean inputs determine which type of signals will trigger the drawing of TP/SL/Entry lines and flags on your chart. They act as a priority system.
drawLinesUtOnly (Draw Lines: UT Only):
What it does: If checked (true), lines and flags will only be drawn when the UT Bot generates a buy/sell signal.
Effect: Isolates UT Bot signals for visual analysis.
drawLinesSmartMoneyOnly (Draw Lines: Smart Money Only):
What it does: If checked (true), lines and flags will only be drawn when the Smart Money Breakout logic generates a bullish/bearish breakout.
Effect: Overrides drawLinesUtOnly if both are checked. Isolates Smart Money signals.
drawLinesCombined (Draw Lines: UT & Smart Money (Combined)):
What it does: If checked (true), lines and flags will only be drawn when both a UT Bot signal AND a Smart Money Breakout signal occur on the same bar.
Effect: Overrides both drawLinesUtOnly and drawLinesSmartMoneyOnly if checked. Provides the strictest entry criteria for line drawing, looking for strong confluence.
Dashboard Metrics Explained
The dashboard provides performance statistics based on the lines drawing control button selected. For example, if "Draw Lines: UT Only" is active, the dashboard will show stats only for UT Bot signals.
Total Signals: The total number of buy or sell signals generated by the selected drawing mode.
TP1 Win Rate: The percentage of signals where the price reached Take Profit 1 (TP1) before hitting the Stop Loss.
TP2 Win Rate: The percentage of signals where the price reached Take Profit 2 (TP2) before hitting the Stop Loss.
TP3 Win Rate: The percentage of signals where the price reached Take Profit 3 (TP3) before hitting the Stop Loss. (Note: TP1, TP2, TP3 are in order of distance from entry, with TP3 being furthest.)
SL before any TP rate: This crucial metric shows the number of times the Stop Loss was hit / the percentage of total signals where the stop loss was triggered before any of the three Take Profit levels were reached. This gives you a clear picture of how often a trade resulted in a loss without ever moving into profit target territory.
Short Tutorial: How to Use the Indicator
Add to Chart: Open your TradingView chart, go to "Indicators," search for "Alpha - Combined Breakout," and add it to your chart.
Access Settings: Once added, click the gear icon next to the indicator name on your chart to open its settings.
Choose Your Signal Mode:
For UT Bot only: Uncheck "Draw Lines: Smart Money Only" and "Draw Lines: UT & Smart Money (Combined)". Ensure "Draw Lines: UT Only" is checked.
For Smart Money only: Uncheck "Draw Lines: UT Only" and "Draw Lines: UT & Smart Money (Combined)". Ensure "Draw Lines: Smart Money Only" is checked.
For Combined Signals: Check "Draw Lines: UT & Smart Money (Combined)". This will override the other two.
Adjust Parameters:
Start with default settings. Observe how the signals appear on your chosen asset and timeframe.
Refine Smart Money: If you see too many "noisy" market structure breaks, increase swingSize. If you want earlier breakouts, try "Wicks" for bosConfType.
Refine UT Bot: Adjust a_ut (Sensitivity) to get more or fewer UT Bot signals. Change c_ut (ATR Period) if you want larger or smaller TP/SL distances. Experiment with h_ut to see if Heikin Ashi smoothing suits your trading style.
Adjust TP/SL Multiplier: If using "Smart Money Only" mode, fine-tune sm_tp_sl_multiplier to set appropriate risk/reward levels.
Interpret Signals & Lines:
Buy/Sell Flags: These indicate the presence of a signal based on your selected drawing mode.
Entry Line (Blue Solid): This is where the signal was generated (usually the close price of the signal candle).
SL Line (Red/Green Solid): Your calculated stop loss level.
TP Lines (Dashed): Your three calculated take profit levels (TP1, TP2, TP3, where TP3 is the furthest target).
Smart Money Lines (BOS/CHoCH): These lines indicate horizontal levels where market structure breaks occurred. CHoCH labels might appear at the first structural break against the prior trend.
Monitor Dashboard: Pay attention to the dashboard in the top right corner. This dynamically updates to show the win rates for each TP and, crucially, the "SL before any TP rate." Use these statistics to evaluate the effectiveness of the indicator's signals under your current settings and chosen mode.
*
Set Alerts (Optional): You can set up alerts for any of the specific signals (UT Bot Long/Short, Smart Money Bullish/Bearish, or the "Line Draw" combined signals) to notify you when they occur, even if you're not actively watching the chart.
By following this tutorial, you'll be able to effectively use and customize the "Alpha - Combined Breakout" indicator to suit your trading strategy.

Reversal Strength Meter – Adib NooraniThe Reversal Strength Meter is an oscillator designed to identify potential reversal zones based on supply and demand dynamics. It uses smoothed stochastic logic to reduce noise and highlight areas where momentum may be weakening, signaling possible market turning points.
🔹 Smooth, noise-reduced stochastic oscillator
🔹 Custom zones to highlight potential supply and demand imbalances
🔹 Non-repainting, compatible across all timeframes and assets
🔹 Visual-only tool — intended to support discretionary trading decisions
This oscillator assists scalpers and intraday traders in tracking subtle shifts in momentum, helping them identify when a market may be preparing to reverse — always keeping in mind that trading is based on probabilities, not certainties.
📘 How to Use the Indicator Efficiently
For Reversal Trading:
Buy Setup
– When the blue line dips below the 20 level, wait for it to re-enter above 20.
– Look for reversal candlestick patterns (e.g., bullish engulfing, hammer, or morning star).
– Enter above the pattern’s high, with a stop loss below its low.
Sell Setup
– When the blue line rises above the 80 level, wait for it to re-enter below 80.
– Look for bearish candlestick patterns (e.g., bearish engulfing, inverted hammer, or evening star).
– Enter below the pattern’s low, with a stop loss above its high.
🛡 Risk Management Guidelines
Risk only 0.5% of your capital per trade
Book 50% profits at a 1:1 risk-reward ratio
Trail the remaining 50% using price action or other supporting indicators

faiz MACDMACD: Moving Average Convergence Divergence
The Moving Average Convergence Divergence (MACD) is a popular momentum indicator used in technical analysis to gauge the strength, direction, and potential reversal points of a trend in a financial asset's price movement. Developed by Gerald Appel in the late 1970s, MACD is particularly favored by traders for its ability to capture both trend-following and momentum aspects of price behavior.
Components of the MACD
The MACD is derived from two exponential moving averages (EMAs) of a security's price:
MACD Line: This is the difference between the 12-day and 26-day EMAs. The shorter 12-day EMA reacts more quickly to price changes, while the 26-day EMA smooths out price fluctuations, offering a longer-term perspective.
Formula: MACD Line = 12-day EMA - 26-day EMA
Signal Line: This is the 1-day EMA of the MACD Line itself. The signal line is used to generate buy and sell signals when it crosses the MACD line.
Formula: Signal Line = 1-day EMA of the MACD Line
MACD Histogram: The histogram represents the difference between the MACD Line and the Signal Line. It is displayed as bars that oscillate above and below a zero line, helping to visualize the convergence or divergence between the two lines.
Formula: Histogram = MACD Line - Signal Line
Interpretation of MACD
The MACD indicator is used to identify potential buy and sell signals based on the following observations:
MACD Line and Signal Line Crossovers:
Bullish Crossover: A buy signal occurs when the MACD Line crosses above the Signal Line. This suggests that the momentum is shifting in favor of the bulls, indicating a potential upward price movement.
Bearish Crossover: A sell signal occurs when the MACD Line crosses below the Signal Line. This suggests a bearish trend may be emerging, signaling a potential downward movement.
Divergence:
Bullish Divergence: Occurs when the price of the asset is making new lows, but the MACD is forming higher lows. This suggests that the downward momentum is weakening and a potential reversal to the upside may be imminent.
Bearish Divergence: Occurs when the price is making new highs, but the MACD is forming lower highs. This suggests that the upward momentum is weakening and a reversal to the downside may occur.
Only use it in timeframe m1, and solely use for XAUUSD pair.
Advisable to use it as a confirmation with other indicator such as
BBMA, SMC, SUPPORT RESISTANCE, SUPPLY AND DEMAND.
how to use :
MA 5 Crossing above MA9, will generate BUY signals
MA 5 Crossing below MA9, will generate SELL signals
Trade at your own SKILLS.
I dont mind people using this script for free.
All I want is just prayer for me and my family success.
Thank You and Have a nice and pleasant day :-)

ICT Immediate Rebalance Toolkit [LuxAlgo]The ICT Immediate Rebalance Toolkit is a comprehensive suite of tools crafted to aid traders in pinpointing crucial trading zones and patterns within the market.
The ICT Immediate Rebalance, although frequently overlooked, emerges as one of ICT's most influential concepts, particularly when considered within a specific context. The toolkit integrates commonly used price action tools to be utilized in conjunction with the Immediate Rebalance patterns, enriching the capacity to discern context for improved trading decisions.
The ICT Immediate Rebalance Toolkit encompasses the following Price Action components:
ICT Immediate Rebalance
Buyside/Sellside Liquidity
Order Blocks & Breaker Blocks
Liquidity Voids
ICT Macros
🔶 USAGE
🔹 ICT Immediate Rebalance
What is an Immediate Rebalance?
Immediate rebalances, a concept taught by ICT, hold significant importance in decision-making. To comprehend the concept of immediate rebalance, it's essential to grasp the notion of the fair value gap. A fair value gap arises from market inefficiencies or imbalances, whereas an immediate rebalance leaves no gap, no inefficiencies, or no imbalances that the price would need to return to.
Rule of Thumb
After an immediate rebalance, the expectation is for two extension candles to follow; otherwise, the immediate rebalance is considered failed. It's important to highlight that both failed and successful immediate rebalances, when considered within a context, are significant signatures in trading.
Immediate rebalances can occur anywhere and in any timeframe.
🔹 Buyside/Sellside Liquidity
In the context of Inner Circle Trader's teachings, liquidity primarily refers to the presence of stop losses or pending orders, that indicate concentrations of buy or sell orders at specific price levels. Institutional traders, like banks and large financial entities, frequently aim for these liquidity levels or pools to accumulate or distribute their positions.
Buyside liquidity denotes a chart level where short sellers typically position their stops, while Sellside liquidity indicates a level where long-biased traders usually place their stops. These zones often serve as support or resistance levels, presenting potential trading opportunities.
The presentation applied here is the multi-timeframe version of our previously published Buyside-Sellside-Liquidity script.
🔹 Order Blocks & Breaker Blocks
Order Blocks and Breaker Blocks hold significant importance in technical analysis and play a crucial role in shaping market behavior.
Order blocks are fundamental elements of price action analysis used by traders to identify key levels in the market where significant buying or selling activity has occurred. These blocks represent areas on a price chart where institutional traders, banks, or large market participants have placed substantial buy or sell orders, leading to a temporary imbalance in supply and demand.
Breaker blocks, also known as liquidity clusters or pools, complement order blocks by identifying zones where liquidity is concentrated on the price chart. These areas, formed from mitigated order blocks, often act as significant barriers to price movement, potentially leading to price stalls or reversals in the future.
🔹 Liquidity Voids
Liquidity voids are sudden price changes when the price jumps from one level to another. Liquidity voids will appear as a single or a group of candles that are all positioned in the same direction. These candles typically have large real bodies and very short wicks, suggesting very little disagreement between buyers and sellers.
Here is our previously released Liquidity-Voids script.
🔹 ICT Macros
In the context of ICT's teachings, a macro is a small program or set of instructions that unfolds within an algorithm, which influences price movements in the market. These macros operate at specific times and can be related to price runs from one level to another or certain market behaviors during specific time intervals. They help traders anticipate market movements and potential setups during specific time intervals.
Here is our previously released ICT-Macros script.
🔶 SETTINGS
🔹 Immediate Rebalances
Immediate Rebalances: toggles the visibility of the detected immediate rebalance patterns.
Bullish, and Bearish Immediate Rebalances: color customization options.
Wicks 75%, %50, and %25: color customization options of the wick price levels for the detected immediate rebalance.
Ignore Price Gaps: ignores price gaps during calculation.
Confirmation (Bars): specifies the number of bars required to confirm the validation of the detected immediate rebalance.
Immediate Rebalance Icon: allows customization of the size of the icon used to represent the immediate rebalance.
🔹 Buyside/Sellside Liquidity
Buyside/Sellside Liquidity: toggles the visibility of the buy-side/sell-side liquidity levels.
Timeframe: this option is to identify liquidity levels from higher timeframes. If a timeframe lower than the chart's timeframe is selected, calculations will be based on the chart's timeframe.
Detection Length: lookback period used for the detection.
Margin: sets margin/sensitivity for the liquidity levels.
Buyside/Sellside Liquidity Color: color customization option for buy-side/sell-side liquidity levels.
Visible Liquidity Levels: allows customization of the visible buy-side/sell-side liquidity levels.
🔹 Order Blocks & Breaker Blocks
Order Blocks: toggles the visibility of the order blocks.
Breaker Blocks: toggles the visibility of the breaker blocks.
Swing Detection Length: lookback period used for the detection of the swing points used to create order blocks & breaker blocks.
Mitigation Price: allows users to select between the closing price or the wick of the candle.
Use Candle Body in Detection: allows users to use candle bodies as order block areas instead of the full candle range.
Remove Mitigated Order Blocks & Breaker Blocks: toggles the visibility of the mitigated order blocks & breaker blocks.
Order Blocks: Bullish, Bearish Color: color customization option for order blocks.
Breaker Blocks: Bullish, Bearish Color: color customization option for breaker blocks.
Visible Order & Breaker Blocks: allows customization of the visible order & breaker blocks.
Show Order Blocks & Breaker Blocks Labels: toggles the visibility of the order blocks & breaker blocks labels.
🔹 Liquidity Voids
Liquidity Voids: toggles the visibility of the liquidity voids.
Liquidity Voids Width Filter: filtering threshold while detecting liquidity voids.
Ignore Price Gaps: ignores price gaps during calculation.
Remove Mitigated Liquidity Voids: remove mitigated liquidity voids.
Bullish, Bearish, and Mitigated Liquidity Voids: color customization option..
Liquidity Void Labels: toggles the visibility of the liquidity voids labels.
🔹 ICT Macros
London and New York (AM, Launch, and PM): toggles the visibility of specific macros, allowing users to customize macro colors.
Macro Top/Bottom Lines, Extend: toggles the visibility of the macro's pivot high/low lines and allows users to extend the pivot lines.
Macro Mean Line: toggles the visibility of the macro's mean (average) line.
Macro Labels: toggles the visibility of the macro labels, allowing customization of the label size.
🔶 RELATED SCRIPTS
ICT-Killzones-Toolkit
Smart-Money-Concepts
Thanks to our community for recommending this script. For more conceptual scripts and related content, we welcome you to explore by visiting >>> LuxAlgo-Scripts .

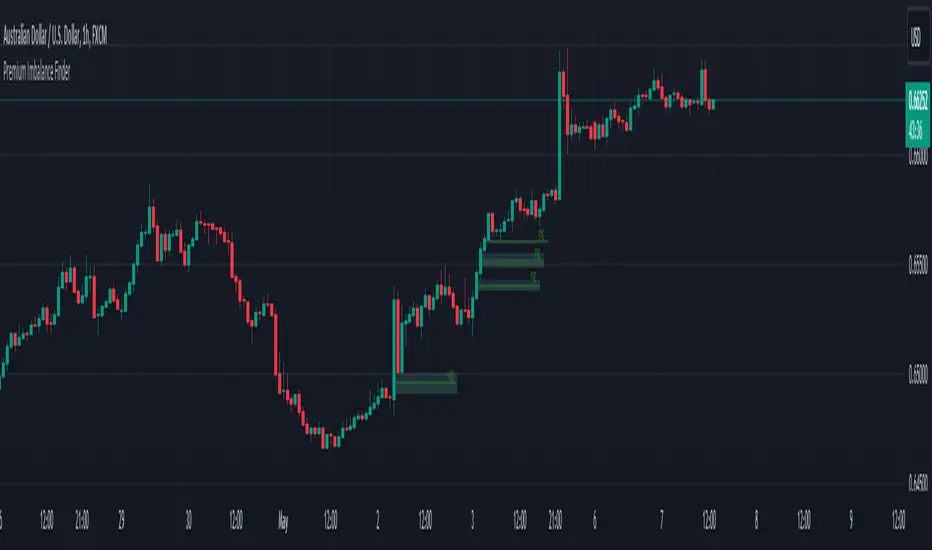
Premium Imbalance FinderIntroducing the Premium Imbalances Indicator, a powerful tool designed help traders identify and analyze market imbalances. This advanced indicator offers a comprehensive suite of features to enhance your trading experience and provide valuable insights into market dynamics.
Key Features:
Fair Value Gap (FVG): Identify price ranges where the market has not achieved fair value, indicating potential imbalances and trading opportunities.
Balanced Price Range (BPR): Visualize price ranges where the market has found a balance between supply and demand.
Volume Imbalance: Detect areas of significant volume imbalance, highlighting the absence of body volume and potential market inefficiencies.
Opening Gap: Identify un-offered price ranges at the opening of a trading session, providing insights into potential market direction.
Customizable Display: Adjust the display limit to control the number of imbalance boxes visible on the chart, ensuring a clutter-free and focused view.
Mitigation Analysis: Set a mitigation level to determine when an imbalance has been mitigated and track the percentage of mitigation for each imbalance.
Higher Timeframe Analysis: Enable the HTF Imbalance feature to analyze imbalances on higher timeframes, providing a broader perspective on market structure.
Customizable Appearance: Personalize the colors of imbalance boxes, premium zones, and mid-lines to suit your visual preferences and easily distinguish between bullish and bearish imbalances.
Flexible Imbalance Extension: Choose between custom, current, or extended imbalance box display to adapt to your trading style and analysis requirements.
Detailed Tooltips: Hover over imbalance labels to view the percentage of mitigation for each imbalance, providing quick and easy access to crucial information.
The Premium Imbalances Indicator is suitable for traders of all levels, from beginners to experienced professionals, and can be used across various markets and timeframes.
By utilizing this powerful tool, traders can gain a deeper understanding of market dynamics, identify potential trading opportunities, and make more informed decisions based on the analysis of imbalances. The indicator's customizable features and detailed insights make it an essential addition to any trader's toolkit.
Imbalance Detector [LuxAlgo]This indicator detects and highlights market imbalances alongside a dashboard returning information about their frequency of occurrence and their fill percentage. Imbalances included in this script are Fair Value Gaps (FVG), Opening Gaps (OG) and Volume Imbalances (VI).
Alerts are available for the occurrences of all market imbalances.
Settings
Imbalances
Each imbalance has the same settings layout:
Imbalance: Enable/disable the detection of the specific imbalance.
Min Width: If enabled, requires the imbalance area width to be greater than the specified value. This minimum width can be expressed in points, percentages or ATR multiples.
Extend: Extend imbalances by a specified number of bars.
Dashboard
Show Dashboard: Enable/disable the dashboard on the chart.
Dashboard Location: Location of the dashboard on the chart.
Dashboard Size: Size of the dashboard.
Usage
Market imbalances are part of the many concepts available to price action traders and highlight areas where there is a disparity between supply and demand.
It is common to see price come back to these areas and traders often use them as supports and resistances but also as targets.
Details
The script can detect three distinct types of imbalances described below.
Fair Value Gaps
Fair Value Gaps (FVG) are three candle formations characterized by a gap between the wicks of the non-adjacent candles in the formation.
A bullish FVG is characterized by a gap between the current price low and the 2 bars anterior price high, and a bearish FVG is characterized by a gap between the current price high and the 2 bars anterior price low.
Opening Gaps
Opening Gaps (OG) are imbalances characterized by non-existent activity within a specific price range.
A bullish OG occurs when the current price low is greater than the previous high, a bearish OG occurs when price high is lower than the previous price low.
Opening Gaps primarily occur in closing markets, as such they are less common in the cryptocurrency market.
Most of the time an Opening Gap will also be accompanied by a Fair Value Gap, in order to avoid clutter the indicator will not detect Fair Value Gaps if Opening Gaps are enabled and if an Opening Gap has been detected
Volume Imbalances
Volume Imbalances (VI) are characterized by a price discontinuity between the opening price and previous close, but unlike Opening Gaps we do not see nonexistent activity within a certain price range.
A bullish VI occur when both the opening and closing prices are superior to the previous closing price, with the current price low overlapping the previous price high. A bearish VI occur when both the opening and closing prices are inferior to the previous closing price, with the current price high overlapping the previous price low.
Because Volume Imbalances can occur excessively on markets with frequent gaps, we make use of an additional condition for filtering out less significant imbalances. Bullish VI's will require the previous price high to be lower than the opening price, while bullish VI's will require the previous price low to be higher than the opening price.

Nonlinear Parametric Oscillator - PSOThis script is in development phase and may be buggy. use with your own risk. The idea here is to determine the sinusoidal directional changes in the supply and demand. Based on direction, you can enter and make huge gains. Recommended to use on 1 min chart. The sideways market would be indicated as flattening in the respective bands. There are four bands, bottom one is where market is in BEAR mode and top one is when market is in BULL mode.
The indicator doesnt work well when the ticker price is less than 10 dollars, i am working on it. Do not use on penny stocks, for the time. More-details when I make this a robust version.

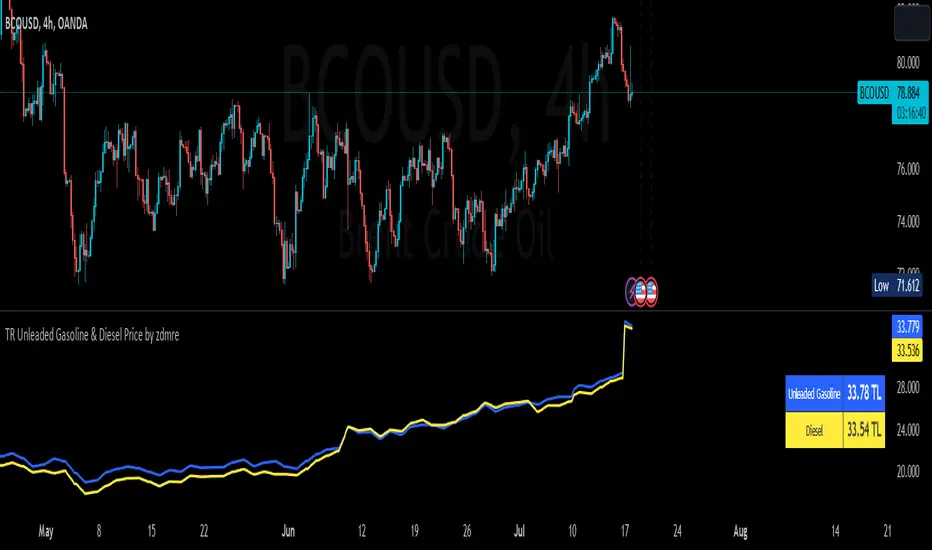
TR Unleaded Gasoline & Diesel Price by zdmreThe price of gasoline can change on any given day. Although a number of factors determine the price per liter, the price of crude oil makes the most impact. The per-barrel price of crude oil is most directly affected by world supply and demand. By closely monitoring the price of crude as well as keeping tabs on a few other factors you can estimate the cost to fill up.
Divide the crude oil (Moving Average) price by 159. One barrel of crude contains 159 liters. This will tell you the dollar amount per liter of refined gasoline attributed to crude. For example, if crude oil is $100 per barrel, then about $0.628 of the price of a liter of gas comes from the crude price.
By multiplying this amount by Dollar/Turkish Lira, special ratio and upper limit, you can get an estimated price per liter.
For example: using $0.628 , multiply by USD/TRY (17 TL), Special Ratio (2.1) and Upperlimit (1.03). An average cost per liter of gasoline is 23.09TL
The similar calculation applies to Diesel.
node nirvanaThis indicator is suitable for those who have studied Mr. Nirvana's course, as well as those who work in the style of supply and demand.

MT INDY S/R Hi guys i am glad to introduce this script to you guys you can use this for your day trading stratagey as supply and demand zones to make full use of it please combine this one with price action so that you guys have some more accuracy
HOW TO USE THIS ONE ?....
Well you can you this as major support and resistance for day trading the red coloured zone is called resistance zone or supply zones and the green coloured zone is called supply zones once the price attain that level we may expect a reversal and if it breakout the trend may continue

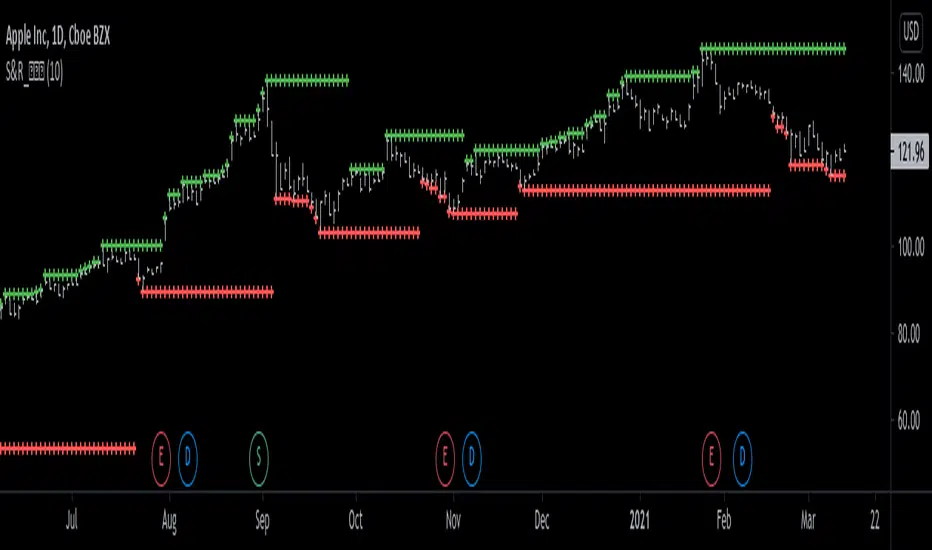
Support and Resistance Levels [racer8]One of the oldest concepts in trading. It's here guys. Drum roll please. Support & resistance baby! 🤣
So many requests from so many people asking me to build this. Finally. It is here guys 😀 Support and Resistance is here by racer8!
Indeed, S&R is used by so many traders. It is often one of the first concepts a trader will learn. I myself, can attest to this.
So what is support and resistance? 🤔
Good question, S&R are certain price levels that are created when a peak or trough has formed. Many traders use these peaks/troughs and extend lines out from them to create support & resistance levels.
Support levels are extended out from troughs. Resistance levels from peaks.
It is often believed that price bounces between these levels due to some unknown mysterious force known as supply and demand. 🙀
If you're a reversal trader, your strategy would likely be trying to short whenever price reaches a resistance level and vice versa for support levels.
If you're a trend trader, your strategy would likely be trying to go long whenever price breaks a resistance level and vice versa for support levels.
This Indicator...
Has one setting that controls which levels are formed. Higher settings equals less levels formed, but more important ones. Don't set it too high or too low. There is an optimal setting. Setting it too high will result in very few levels and thus, too little opportunities to trade. Setting it too low means the indicator will give you insignificant levels..also bad idea. So try to find something optimal like 10 to 20 periods for instance. 👍
Enjoy and have a blast!😀
Peace, I'm out! 🙏 💥
Freedom of MovementFreedom of Movement Indicator
---------------------------------------------------------
In “Evidence-Based Support & Resistance” article, author Melvin Dickover introduces two new indicators to help traders note support and resistance areas by identifying supply and demand pools. Here you can find the support-resistance technical indicator called "Freedom of Movement".
The indicator takes into account price-volume behavior in order to detect points where movement of price is suddenly restricted, the possible supply and demand pools. These points are also marked by Defended Price Lines (DPLs).
DPLs are horizontal lines that run across the chart at levels defined by following conditions:
* Overlapping bars: If the indicator spike (i.e., indicator is above 2.0 or a custom value) corresponds to a price bar overlapping the previous one, the previous close can be used as the DPL value.
* Very large bars: If the indicator spike corresponds to a price bar of a large size, use its close price as the DPL value.
* Gapping bars: If the indicator spike corresponds to a price bar gapping from the previous bar, the DPL value will depend on the gap size. Small gaps can be ignored: the author suggests using the previous close as the DPL value. When the gap is big, the close of the latter bar is used instead.
* Clustering spikes: If the indicator spikes come in clusters, use the extreme close or open price of the bar corresponding to the last or next to last spike in cluster.
DPLs can be used as support and resistance levels. In order confirm and refine them, FoM (Freedom of Movement) is used along with the Relative Volume Indicator (RVI), which you can find here:
Clustering spikes provide the strongest DPLs while isolated spikes can be used to confirm and refine those provided by the RVI. Coincidence of spikes of the two indicator can be considered a sign of greater strength of the DPL.
More info:
S&C magazine, April 2014.

VPT_OBVThis is a derivation of the On Balance Volume Indicator.
The idea behind it is that volume consists of two parts. The driving theory is the basic law of supply and demand.
Part 1: Volume consists of shares traded at an equilibrium price. An equal number of buyers and sellers are present during this volume. This area is displayed as the upper and lower shadows on a single candlestick. For this indicator, volume traded in equilibrium is not included in the display.
Part 2: Volume consists of shares that are not traded at an equilibrium price, driving price up or down for the time period. In this volume, buyers or sellers are not present in equal numbers. This area is displayed as the body of the candlestick. This indicator focuses on this part of volume.
VPT_OBV plots only the volume that occurs at the difference in price between the open and the close. To achieve this, volume is divided by the difference between the high and the low (in pennies). Next, the difference between the open and close is calculated (in pennies). Volume is then divided by the difference in the high and low, to get the amount of volume needed to move the asset up or down by $0.01 during the time period. This number is then multiplied by the difference between the open and close.
VPT_OBV plots the outcome as a cumulative total. A simple moving average of the VPT_OBV is thrown in to provide smoothing.

SMC POI Entry System HUDEntry, RR, Exit, of supply and demand zones taught in smart money trading. 12 types of zones and setups around Flips, Order Blocks, High Probability, and Extreme Demand Zones. Includes Checklist for Entry, Exit Rules, Take Profit Targets, Stop Loss spots, and Context

Binance Spot vs Perpetual Price index by BIGTAKER📌 Overview
This indicator calculates the premium (%) between Binance Perpetual Futures and Spot prices in real time and visualizes it as a column-style chart.
It automatically detects numeric prefixes in futures symbols—such as `1000PEPE`, `1MFLUX`, etc.—and applies the appropriate scaling factor to ensure accurate 1:1 price comparisons with corresponding spot pairs, without requiring manual configuration.
Rather than simply showing raw price differences, this tool highlights potential imbalances in supply and demand, helping to identify phases of market overheating or panic selling.
🔧 Component Breakdown
1. ✅ Auto Symbol Mapping & Prefix Scaling
Automatically identifies and processes common numeric prefixes (`1000`, `1M`, etc.) used in Binance perpetual futures symbols.
Example:
`1000PEPEUSDT.P` → Spot symbol: `PEPEUSDT`, Scaling factor: `1000`
This ensures precise alignment between futures and spot prices by adjusting the scale appropriately.
2. 📈 Premium Calculation Logic
Formula:
(Scaled Futures Price − Spot Price) / Spot Price × 100
Interpretation:
* Positive (+) → Futures are priced higher than spot: indicates possible long-side euphoria
* Negative (−) → Futures are priced lower than spot: indicates possible panic selling or oversold conditions
* Zero → Equilibrium between futures and spot pricing
3. 🎨 Visualization Style
* Rendered as column plots (bar chart) on each candle
* Color-coded based on premium polarity:
* 🟩 Positive premium: Light green (`#52ff7d`)
* 🟥 Negative premium: Light red (`#f56464`)
* ⬜ Neutral / NA: Gray
* A dashed horizontal line at 0% is included to indicate the neutral zone for quick visual reference
💡 Strategic Use Cases
| Market Behavior | Strategy / Interpretation |
| ----------------------------------------- | ------------------------------------------------------------------------ |
| 📈 Premium surging | Strong futures demand → Overheated longs (short setup) |
| 📉 Premium dropping | Aggressive selling in futures → Oversold signal (long setup) |
| 🔄 Near-zero premium | Balanced market → Wait and observe or reassess |
| 🧩 Combined with funding rate or OI delta | Enables multi-factor confirmation for short-term or mid-term signals |
🧠 Technical Advantages
* Fully automated scaling for prefixes like `1000`, `1M`, etc.
* Built-in error handling for inactive or missing symbols (`ignore_invalid_symbol=true`)
* Broad compatibility with Binance USDT Spot & Perpetual Futures markets
🔍 Target Use Cases & Examples
Compatible symbols:
`1000PEPEUSDT.P`, `DOGEUSDT.P`, `1MFLUXUSDT.P`, `ETHUSDT.P`, and most other Binance USDT-margined perpetual futures
Works seamlessly with:
* Binance Spot Market
* Binance Perpetual Futures Market

BTC HASHRATE DROP: OnchainWhy is the drop of hashrate important?
Drop of hashrate usually occurs because some miners in the mining network stop for working. There are several possible reasons for this. Such as new anti-mining regulations in some countries or a sharp drop in the price of bitcoin, which makes mining no longer affordable for some miners. So they turn off their devices
This reduces the supply of bitcoin in the market and according to the law of supply and demand can eventually lead to an increase in the price of bitcoin.
This oscillator is designed to detect hashrate drop. for this, we use the data of glassnode . Maroon color indicates decrease in hashrate and Red color indicates excessive hash rate drop. As can be seen on the chart, usually after this drop, we see an increase in the price of bitcoin

SMA Cross + Adaptive Q MA + AMA Channel
📘 OPERATIONAL MANUAL: Adaptive Trend & SR Breakout SystemThis system combines non-parametric regression, volatility channels, and automated price action structures to identify high-probability entries.
1. Core IndicatorsAdaptive Q (KAMA): The primary trend line.
Green = Bullish;
Red = Bearish.
AMA Channel: An ATR-based envelope ($1.5 \times ATR$) that defines the "Value Area".
SMA 50 Filter: Global trend filter. Trade Long only above; Short only below.
SR Zones: Automatic boxes marking historical Support
(Blue/Green) and Resistance (Red).Shutterstock
2. Entry Rules
🟢 LONG SETUP:Price is above SMA 50.Large Lime Triangle appears (Channel Cross).Adaptive Q line is Green.Best entry: Price bounces off a Support Box.
🔴 SHORT SETUP:Price is below SMA 50.Large Red Triangle appears (Channel Cross).Adaptive Q line is Red.Best entry: Price rejects a Resistance Box.
3. Risk Management
Stop Loss: Set at $1.5 \times ATR$ or behind the nearest SR Box.
Take Profit: Target the next opposite SR Zone or exit if the Adaptive Q changes color.
4. LegendLarge Triangles: High-conviction volatility signals.
Small Triangles: Standard SMA Cross (early warning).
Red/Green Boxes: Supply and Demand zones for structural confirmation.

RSI PVSRA PRO Edition# 📑 MASTER OPERATING MANUAL: Full Institutional Ecosystem (v3.0)
**Integrated Suite:** PVSRA Dashboard + SR Boxes + Order Spikes + CVD-100 + RSI PRO
---
## 1. SYSTEM HIERARCHY
This ecosystem provides a 360-degree view of the market, eliminating subjective interpretation:
1. **Bias (Dashboard):** Global market direction (Sentiment).
2. **Context (SR Boxes):** Institutional supply and demand zones (The "Where").
3. **Internal Force (CVD-100):** Aggressive money flow (The "Fuel").
4. **Momentum & Divergence (RSI PRO):** Speedometer and early-warning system for reversals.
---
## 2. COMPONENT DICTIONARY
### **A. RSI PRO (Divergences & Confluence)**
* **Bullish Divergence (Green Label):** Price makes a Lower Low, but RSI makes a Higher Low. Indicates hidden institutional accumulation.
* **Bearish Divergence (Red Label):** Price makes a Higher High, but RSI makes a Lower High. Indicates institutional distribution (unloading).
* **Safety Thresholds:** * *Safe Buy Zone (< 65):* Prevents buying into overextended markets.
* *Safe Sell Zone (> 35):* Prevents selling at absolute bottoms.
### **B. CVD-100 (Aggressive Pressure)**
* **Above 80:** Buyer exhaustion. **Below 20:** Seller exhaustion.
* **Slope:** A Lime color indicates buyers are hitting the Ask; Red indicates sellers are hitting the Bid.
### **C. PVSRA & Spikes (The Trigger)**
* **Climax Candles (Green/Magenta):** Marks the peak of professional activity.
* **Triangles (▲/▼):** Statistical confirmation of a massive order execution.
---
## 3. INTEGRATED TRADING STRATEGIES
### **Strategy A: The "Golden Pocket" Reversal (High Accuracy)**
1. **Zone:** Price enters a **Teal SR Box** (Support).
2. **Momentum:** **RSI PRO** displays a **Bullish Divergence** (Green Label).
3. **Volume:** A **Magenta Climax Candle** (PVSRA) appears.
4. **Flow:** **CVD-100** crosses above the 20 level.
5. **Trigger:** A **Buy Spike (▲)** or a **Diamond (◆)** appears.
* *Target:* Next Red Box or Dashed Recovery Line.
### **Strategy B: Momentum Breakout (Trend Following)**
1. **Bias:** Dashboard shows "STRONG BUY" + Price above SMA 200.
2. **RSI Filter:** RSI is below 65 (not yet in extreme overbought territory).
3. **Action:** Price breaks through a **Red SR Box** (Resistance) with force.
4. **Confirmation:** **CVD-100** is Lime (Buying pressure) + **RSI SMA** points upward.
* *Entry:* Close of the breakout candle.
---
## 4. ULTIMATE CONFLUENCE CHECKLIST (MANDATORY)
| Priority | Indicator | Trade Requirement |
| :--- | :--- | :--- |
| **1. Bias** | Dashboard | Must be "STRONG" in the trade direction |
| **2. Context**| SR Boxes | Price must be near a Box (Teal/Red) |
| **3. Momentum**| RSI PRO | Presence of Divergence OR RSI within thresholds (65/35) |
| **4. Internal** | CVD-100 | Slope must be aligned with the trade direction |
| **5. Trigger** | Spike Det. | Presence of Triangle (▲/▼) or Diamond (◆) |
---
## 5. RECOMMENDED TECHNICAL SETTINGS
| Indicator | Parameter | Suggested Value |
| :--- | :--- | :--- |
| **RSI PRO** | Length | 14 |
| **RSI PRO** | Confluence | 65 (Max Buy) / 35 (Min Sell) |
| **CVD-100** | Normalization| 50 (Stochastic Mode) |
| **PVSRA** | Climax Factor | 2.7 |
---
## 6. PRO TIPS & RISK MANAGEMENT
* ⚠️ **The Divergence Rule:** An RSI divergence occurring inside an **SR Box** is 3x more powerful than a divergence in a vacuum.
* ⚠️ **RSI + CVD Synergy:** If the RSI shows a bullish divergence AND the CVD-100 is rising from the 20 level, you have identified a massive institutional "floor."
* ⚠️ **Smoothing MA:** If the yellow RSI line is flat, the market is ranging. Wait for a clear slope before acting.
---
*Document created for Quantitative Trading Operations*

Professional Grid & Reversal Bot v10 (Binance Style)Professional Grid & Reversal Bot v10 (Binance Style) – Open Source & Educational
About this Script:
This script is an advanced Grid Trading & Smart Reversal strategy, inspired by professional Binance-style execution. It is designed as an educational, open-source tool for traders who want to understand market dynamics, grid logic, and risk management.
How it Works:
1️⃣ Grid Execution:
• Divides the price range between the high and low into multiple levels (Grids).
• Opens Buy orders in the lower half and Sell orders in the upper half.
• Levels are calculated dynamically based on the highest and lowest prices over a selected lookback period.
2️⃣ Smart Reversal System:
• Detects price touches on the high or low range boundaries to identify potential reversal points.
• Opens Buy orders at the lows and Sell orders at the highs using a configurable confirmation percentage (revPct).
• Helps traders capture short-term price swings effectively.
3️⃣ Risk & Size Management:
• Position sizing based on USD amount and leverage.
• Automatic Take Profit (TP) and Stop Loss (SL) for every trade.
• Controls overtrading via the "pyramiding" parameter (max open trades).
4️⃣ Advanced Visualization:
• Plots the grid range with high/low levels and fills the background for clear context.
• Highlights potential Supply and Demand Zones.
• Displays a dynamic "Binance-style" Order Book table showing Side, Price, Quantity, and PnL.
5️⃣ Key Counters & Indicators:
• levelsArr → Stores all grid levels for execution and plotting.
• touchedHigh / touchedLow → Monitors range touches to trigger reversals.
• strategy.openprofit → Displays live open trade PnL directly on the chart.
Additional Features:
• Supports both English and Arabic languages.
• Dark Theme optimized for readability.
• Dynamic control panel updates on every bar.
• Flexible settings for Auto or Manual grid range updates.
User Guidance:
• This script is for educational purposes only; it does not guarantee profits.
• We recommend adjusting Grid Levels, Reversal Percentage, and Trade Size to experiment with different strategies.
Community Engagement:
• Suggestions and improvements are welcome! 💡
• If you have ideas for new features, let's develop them together to enhance learning.
• Please support the script with a Like & Boost if you find it useful.
• Encourages knowledge sharing to improve collective performance.
License:
Creative Commons Attribution-NonCommercial 4.0 International (CC BY-NC 4.0)
Free for educational use only. Please give credit to the author when sharing or modifying the script.

Smart Money Flow Oscillator [MarkitTick]💡This script introduces a sophisticated method for analyzing market liquidity and institutional order flow. Unlike traditional volume indicators that treat all market activity equally, the Smart Money Flow Oscillator (SMFO) employs a Logic Flow Architecture (LFA) to filter out market noise and "churn," focusing exclusively on high-impact, high-efficiency price movements. By synthesizing price action, volume, and relative efficiency, this tool aims to visualize the accumulation and distribution activities that are often attributed to "smart money" participants.
✨ Originality and Utility
Standard indicators like On-Balance Volume (OBV) or Money Flow Index (MFI) often suffer from noise because they aggregate volume based simply on the close price relative to the previous close, regardless of the quality of the move. This script differentiates itself by introducing an "Efficiency Multiplier" and a "Momentum Threshold." It only registers volume flow when a price move is considered statistically significant and structurally efficient. This creates a cleaner signal that highlights genuine supply and demand imbalances while ignoring indecisive trading ranges. It combines the trend-following nature of cumulative delta with the mean-reverting insights of an In/Out ratio, offering a dual-mode perspective on market dynamics.
🔬 Methodology
The underlying calculation of the SMFO relies on several distinct quantitative layers:
• Efficiency Analysis
The script calculates a "Relative Efficiency" ratio for every candle. This compares the current price displacement (body size) per unit of volume against the historical average.
If price moves significantly with relatively low volume, or proportional volume, it is deemed "efficient."
If significant volume occurs with little price movement (churn/absorption), the efficiency score drops.
This score is clamped between a user-defined minimum and maximum (Efficiency Cap) to prevent outliers from distorting the data.
• Momentum Thresholding
Before adding any data to the flow, the script checks if the current price change exceeds a volatility threshold derived from the previous candle's open-close range. This acts as a gatekeeper, ensuring that only "strong" moves contribute to the oscillator.
• Variable Flow Calculation
If a move passes the threshold, the script calculates the flow value by multiplying the Typical Price and Volume (Money Flow) by the calculated Efficiency Multiplier.
Bullish Flow: Strong upward movement adds to the positive delta.
Bearish Flow: Strong downward movement adds to the negative delta.
Neutral: Bars that fail the momentum threshold contribute zero flow, effectively flattening the line during consolidation.
• Calculation Modes
Cumulative Delta Flow (CDF): Sums the flow values over a rolling period. This creates a trend-following oscillator similar to OBV but smoother and more responsive to real momentum.
In/Out Ratio: Calculates the percentage of bullish inflow relative to the total absolute flow over the period. This oscillates between 0 and 100, useful for identifying overextended conditions.
📖 How to Use
Traders can utilize this oscillator to identify trend strength and potential reversals through the following signals:
• Signal Line Crossovers
The indicator plots the main Flow line (colored gradient) and a Signal line (grey).
Bullish (Green Cloud): When the Flow line crosses above the Signal line, it suggests rising buying pressure and efficient upward movement.
Bearish (Red Cloud): When the Flow line crosses below the Signal line, it suggests dominating selling pressure.
• Divergences
The script automatically detects and plots divergences between price and the oscillator:
Regular Divergence (Solid Lines): Suggests a potential trend reversal (e.g., Price makes a Lower Low while Oscillator makes a Higher Low).
Hidden Divergence (Dashed Lines): Suggests a potential trend continuation (e.g., Price makes a Higher Low while Oscillator makes a Lower Low).
"R" labels denote Regular, and "H" labels denote Hidden divergences.
• Dashboard
A dashboard table is displayed on the chart, providing real-time metrics including the current Efficiency Multiplier, Net Flow value, and the active mode status.
• In/Out Ratio Levels
When using the Ratio mode:
Values above 50 indicate net buying pressure.
Values below 50 indicate net selling pressure.
Approaching 70 or 30 can indicate overbought or oversold conditions involving volume exhaustion.
⚙️ Inputs and Settings
Calculation Mode: Choose between "Cumulative Delta Flow" (Trend focus) or "In/Out Ratio" (Oscillator focus).
Auto-Adjust Period: If enabled, automatically sets the lookback period based on the chart timeframe (e.g., 21 for Daily, 52 for Weekly).
Manual Period: The rolling lookback length for calculations if Auto-Adjust is disabled.
Efficiency Length: The period used to calculate the average body and volume for the efficiency baseline.
Eff. Min/Max Cap: Limits the impact of the efficiency multiplier to prevent extreme skewing during anomaly candles.
Momentum Threshold: A factor determining how much price must move relative to the previous candle to be considered a "strong" move.
Show Dashboard/Divergences: Toggles for visual elements.
🔍 Deconstruction of the Underlying Scientific and Academic Framework
This indicator represents a hybrid synthesis of academic Market Microstructure theory and classical technical analysis. It utilizes an advanced algorithm to quantify "Price Impact," leveraging the following theoretical frameworks:
• 1. The Amihud Illiquidity Ratio (2002)
The core logic (calculating body / volume) functions as a dynamic implementation of Yakov Amihud’s Illiquidity Ratio. It measures price displacement per unit of volume. A high efficiency score indicates that "Smart Money" has moved the price significantly with minimal resistance, effectively highlighting liquidity gaps or institutional control.
• 2. Kyle’s Lambda (1985) & Market Depth
Drawing from Albert Kyle’s research on market microstructure, the indicator approximates Kyle's Lambda to measure the elasticity of price in response to order flow. By analyzing the "efficiency" of a move, it identifies asymmetries—specifically where price reacts disproportionately to low volume—signaling potential manipulation or specific Market Maker activity.
• 3. Wyckoff’s Law of Effort vs. Result
From a classical perspective, the algorithm codifies Richard Wyckoff’s "Effort vs. Result" logic. It acts as an oscillator that detects anomalies where "Effort" (Volume) diverges from the "Result" (Price Range), predicting potential reversals.
• 4. Quantitative Advantage: Efficiency-Weighted Volume
Unlike linear indicators such as OBV or Chaikin Money Flow—which treat all volume equally—this indicator (LFA) utilizes Efficiency-Weighted Volume. By applying the efficiency_mult factor, the algorithm filters out market noise and assigns higher weight to volume that drives structural price changes, adopting a modern quantitative approach to flow analysis.
● Disclaimer
All provided scripts and indicators are strictly for educational exploration and must not be interpreted as financial advice or a recommendation to execute trades. I expressly disclaim all liability for any financial losses or damages that may result, directly or indirectly, from the reliance on or application of these tools. Market participation carries inherent risk where past performance never guarantees future returns, leaving all investment decisions and due diligence solely at your own discretion.

WoAlgo Premium v3.0
WoAlgo Premium v3.0 - Smart Money Analysis
Overview
** WoAlgo Premium v3.0 ** is an advanced technical analysis indicator designed for educational purposes. This tool combines Smart Money Concepts with multi-factor confluence analysis to help traders identify potential market opportunities across multiple timeframes.
The indicator integrates market structure analysis, order flow concepts, and technical momentum indicators into a comprehensive dashboard system. It is designed to assist traders in understanding institutional trading patterns and market dynamics through visual analysis tools.
### What It Does
This indicator provides:
**1. Smart Money Concepts Analysis**
- Market structure identification (Break of Structure and Change of Character patterns)
- Order block detection with volume confirmation
- Fair value gap recognition
- Liquidity zone mapping (equal highs and lows)
- Premium and discount zone calculations
**2. Multi-Factor Confluence Scoring**
The indicator calculates a proprietary confluence score (0-100) based on five key components:
- Price action analysis (30% weight)
- Volume confirmation (20% weight)
- Momentum indicators (25% weight)
- Trend strength measurement (15% weight)
- Money flow analysis (10% weight)
**3. Multi-Timeframe Analysis**
- Scans 5 different timeframes (5M, 15M, 1H, 4H, Daily)
- Calculates alignment percentage across timeframes
- Displays trend and structure status for each period
**4. Visual Dashboard System**
- Comprehensive main dashboard with 13 metrics
- Real-time screener table with 10 data columns
- Multi-timeframe scanner
- Performance tracking panel
### How It Works
**Market Structure Detection**
The indicator identifies key structural changes in price action:
- **BOS (Break of Structure)**: Indicates trend continuation when price breaks previous swing points
- **CHoCH (Change of Character)**: Signals potential trend reversal when market structure shifts
**Order Block Identification**
Order blocks are detected when:
- Significant volume appears at swing points
- Price shows strong directional movement from these levels
- Enhanced detection with extreme volume confirmation (OB++ markers)
**Fair Value Gap Recognition**
Gaps between candles are identified when:
- Price leaves inefficiencies in the market
- Three consecutive candles create a gap pattern
- Gap size exceeds minimum threshold based on ATR
**Confluence Calculation**
The system evaluates multiple technical factors:
1. **Price Position**: Relative to moving averages (EMA 20, 50, 200)
2. **Volume Analysis**: Standard deviation-based volume spikes
3. **Momentum**: RSI, MACD, Stochastic indicators
4. **Trend Strength**: ADX measurements
5. **Money Flow**: MFI indicator readings
Each factor contributes weighted points to create an overall confluence score that helps assess signal strength.
### Signal Types
**Confirmation Signals (▲ / ▼)**
Generated when:
- EMA crossovers occur (20/50 cross)
- Volume confirmation is present
- RSI is in appropriate zone
- Confluence score exceeds 50%
**Strong Signals (▲+ / ▼+)**
Higher-confidence signals requiring:
- Confluence score above 70%
- Extreme volume confirmation
- Alignment with 200 EMA trend
- MACD confirmation
- Bullish or bearish market structure
**Contrarian Signals (⚡)**
Reversal indicators appearing when:
- RSI reaches extreme levels (<30 or >70)
- Stochastic shows oversold/overbought conditions
- Price touches Bollinger Band extremes
- Potential divergence patterns emerge
**Reversal Zones**
Visual boxes highlighting areas where:
- Market structure conflicts with momentum
- High probability of directional change
- Key support/resistance levels interact
**Smart Trail**
Dynamic stop-loss indicator that:
- Adjusts based on ATR (Average True Range)
- Follows trend direction
- Updates automatically as price moves
- Provides risk management reference points
### Dashboard Components
**Main Dashboard (13 Metrics)**
1. **Confluence Score**: Current bull/bear percentage (0-100)
2. **Market Regime**: Trend classification (Strong Up/Down, Range, Squeeze)
3. **Signal Status**: Active buy/sell signal indication
4. **Structure State**: Current market structure (Bullish/Bearish/Neutral)
5. **Trend Strength**: ADX-based measurement
6. **RSI Level**: Momentum indicator with overbought/oversold zones
7. **MACD Direction**: Trend momentum confirmation
8. **Money Flow Index**: Smart money sentiment
9. **Volume Status**: Current volume relative to average
10. **Volatility Rating**: ATR percentage measurement
11. **ATR Value**: Average true range for position sizing
12. **MTF Alignment**: Multi-timeframe agreement percentage
**Screener Table (10 Columns)**
- Current symbol and timeframe
- Real-time price and percentage change
- Quality rating (star system)
- Active signal type
- Smart trail status
- Market structure state
- MACD direction
- Trend strength percentage
- Bollinger Band squeeze detection
**MTF Scanner (5 Timeframes)**
Displays for each timeframe:
- Trend direction indicator
- Market structure classification
- Visual confirmation with color coding
**Performance Metrics**
- Win rate percentage (simplified calculation)
- Total signals generated
- Current confluence score
- MTF alignment status
- Volatility level
### Settings and Customization
**Preset Styles**
Choose from predefined configurations:
- **Conservative**: Fewer, higher-quality signals
- **Moderate**: Balanced approach (recommended)
- **Aggressive**: More frequent signals
- **Scalper**: Short-term focused
- **Swing**: Longer-term oriented
- **Custom**: Full manual control
**Smart Money Concepts Controls**
- Toggle each feature independently
- Adjust swing length (3-50 periods)
- Enable/disable internal structure
- Control order block display
- Manage breaker block visibility
- Show/hide fair value gaps
- Display liquidity zones
- Premium/discount zone visualization
**Signal Configuration**
- Enable/disable confirmation signals
- Toggle strong signal markers
- Control contrarian signal display
- Show/hide reversal zones
- Smart trail activation
- Sensitivity adjustment (5-50)
**Visual Customization**
- Moving average display options
- MA period adjustments (Fast: 20, Slow: 50, Trend: 200)
- Support/resistance line toggle
- Dynamic S/R lookback period
- Candle coloring based on trend
- Color scheme customization
- Dashboard size options (Small/Normal/Large)
- Position placement (4 corners)
### How to Use
**Step 1: Initial Setup**
1. Add indicator to chart
2. Select appropriate preset or use Custom
3. Adjust timeframe to match trading style
4. Configure dashboard visibility preferences
**Step 2: Analysis Workflow**
1. Check MTF Scanner for timeframe alignment
2. Review Main Dashboard confluence score
3. Observe Market Regime classification
4. Identify active signals on chart
5. Confirm with Smart Money Concepts (order blocks, FVG, structure)
**Step 3: Trade Consideration**
Strong signals (▲+ / ▼+) require:
- Confluence score >70%
- MTF alignment >60%
- Confirmation from multiple dashboard metrics
- Support from Smart Money Concepts
- Appropriate volume levels
**Step 4: Risk Management**
- Use Smart Trail as dynamic stop-loss reference
- Consider ATR for position sizing
- Monitor volatility rating
- Respect support/resistance levels
- Combine with personal risk parameters
### Best Practices
**For Scalping (1M-5M timeframes)**
- Use Scalper preset
- Reduce swing length to 5-7
- Focus on strong signals only
- Monitor MTF alignment closely
- Quick entries near order blocks
**For Intraday Trading (15M-1H timeframes)**
- Use Moderate preset (recommended)
- Default swing length (10)
- Combine confirmation and strong signals
- Check MTF scanner before entry
- Use fair value gaps for entries
**For Swing Trading (4H-D timeframes)**
- Use Swing preset
- Increase swing length to 15-20
- Focus on strong signals
- Require high MTF alignment
- Patient approach with major structure levels
### Technical Specifications
**Indicators Used**
- Exponential Moving Averages (20, 50, 200)
- Hull Moving Average
- Relative Strength Index (14)
- MACD (12, 26, 9)
- Money Flow Index (14)
- Stochastic Oscillator (14, 3)
- ADX / DMI (14)
- Bollinger Bands (20, 2)
- ATR (14)
- Volume Analysis (SMA 20 with standard deviation)
**Calculation Methods**
- Swing detection using pivot high/low functions
- Volume confirmation via statistical analysis
- Multi-factor scoring with weighted components
- Dynamic support/resistance using highest/lowest functions
- Real-time MTF data via security() function
### Limitations and Considerations
**Important Notes**
1. This indicator is designed for educational and analytical purposes only
2. Historical performance does not guarantee future results
3. Signals should be confirmed with additional analysis
4. Market conditions vary and affect indicator performance
5. Not all signals will be profitable
6. Risk management is essential for all trading
**Known Limitations**
- Confluence scoring is algorithmic and not predictive
- MTF analysis requires sufficient historical data
- Effectiveness varies across different market conditions
- Sideways markets may produce conflicting signals
- High volatility can affect signal reliability
- Backtesting results shown are simplified calculations
**Not Suitable For**
- Automated trading without human oversight
- Sole basis for trading decisions
- Guaranteed profit expectations
- Inexperienced traders without proper education
- Trading without risk management plans
### Market Applicability
**Effective On**
- Trending markets (any direction)
- Clear structure formation periods
- Liquid instruments with consistent volume
- Multiple asset classes (forex, stocks, crypto, commodities)
- Various timeframes with appropriate settings
**Less Effective During**
- Extended ranging/choppy conditions
- Extremely low volume periods
- Major news events causing gaps
- Early market open with high spread
- Illiquid instruments with erratic price action
### Risk Disclaimer
**⚠️ IMPORTANT NOTICE**
This indicator is provided for **educational and informational purposes only**. It does not constitute financial advice, investment recommendations, or trading signals.
**Key Risk Factors:**
- Trading financial instruments involves substantial risk of loss
- Past performance does not indicate future results
- No indicator can predict market movements with certainty
- Users should conduct independent research and analysis
- Professional financial advice should be sought when appropriate
- Risk management and position sizing are critical to successful trading
- Users are solely responsible for their trading decisions
**Responsible Usage:**
- Combine with comprehensive market analysis
- Use appropriate stop-loss orders
- Never risk more than you can afford to lose
- Maintain realistic expectations
- Continue education on technical analysis principles
- Test thoroughly on demo accounts before live trading
- Understand all indicator features before using
### Educational Resources
**Understanding Smart Money Concepts**
Smart Money Concepts analyze how institutional traders and large market participants operate. Key principles include:
- Institutional order flow patterns
- Market structure changes
- Liquidity manipulation
- Supply and demand imbalances
- Order block formations
**Multi-Timeframe Analysis Theory**
Analyzing multiple timeframes helps:
- Identify overall market direction
- Improve entry timing
- Confirm trend strength
- Recognize consolidation periods
- Reduce conflicting signals
**Confluence Trading Approach**
Using multiple confirming factors:
- Increases signal reliability
- Reduces false signals
- Provides conviction for trades
- Helps with position sizing
- Improves risk-reward ratios
### Version History
**v3.0 (Current)**
- Multi-factor confluence scoring system
- Complete Smart Money Concepts implementation
- Real-time multi-timeframe analysis
- Four professional dashboard panels
- Enhanced order block detection
- Breaker block identification
- Premium/discount zone calculations
- Smart trail stop-loss system
- Customizable preset configurations
- Performance tracking metrics
**Development Philosophy**
This indicator was developed with focus on:
- Educational value for traders
- Transparent methodology
- Comprehensive feature set
- User-friendly interface
- Flexible customization options
### Technical Support
**For Questions About:**
- Indicator functionality
- Parameter optimization
- Signal interpretation
- Dashboard metrics
- Best practice recommendations
Please use TradingView's comment section below. The developer monitors comments and provides assistance to users learning to use the indicator effectively.
### Acknowledgments
This indicator implements concepts from:
- Smart Money Concepts trading methodology
- Multi-timeframe analysis techniques
- Technical indicator theory
- Market structure analysis principles
- Institutional order flow concepts
All implementations are original code and calculations based on established technical analysis principles.
---
## ADDITIONAL INFORMATION SECTION
**Category**: Indicators
**Type**: Market Structure / Multi-Timeframe Analysis
**Complexity**: Intermediate to Advanced
**Open Source**: Code visible for transparency and education
**Pine Script Version**: v6
**Chart Overlay**: Yes
**Maximum Objects**: 500 boxes, 500 lines, 500 labels
